
5 Interesting Learnings From Figma at $900,000,000+ ARR. The B2B IPO of The Year?
"A full two-thirds of Figma’s customer base identifies as non-designers (product managers, developers, marketers, executives)."

Figma has just unleashed its non-confidential IPO filing, and it’s … epic.
Here’s what Figma looks like today:
📊 Core Metrics
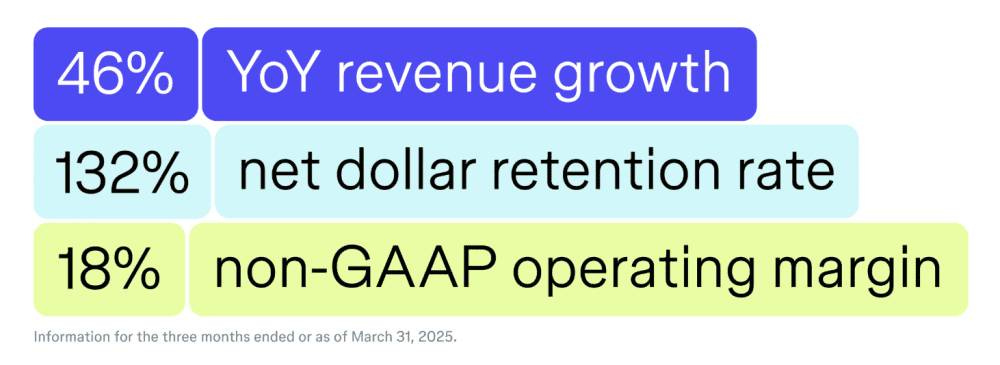
$821M LTM revenue (46% YoY growth)
$913M ARR at Q1’2025
91% gross margins (best-in-class)
18% non-GAAP operating margin (profitable!)
132% net dollar retention
$1.5B+ cash, zero debt
🏢 Market Position
78% of Fortune 2000 use Figma
76% of customers use 2+ products
Millions of weekly active users
13 years from founding to IPO filing

Data-Driven Learning #1: Non-Designers Drive 67% of Revenue Growth
The Data: Two-thirds of Figma’s customer base identifies as non-designers (product managers, developers, marketers, executives).
Why This Matters: The math is stunning. If we assume Figma started with 100% designer users in 2012, they’ve systematically expanded their user base by 33x beyond their core persona.
Revenue Impact Analysis:
Core designers: ~33% of user base
Adjacent users: ~67% of user base
Implication: For every designer Figma acquires, they average 2+ adjacent users
The Takeaway: TAM expansion isn’t about finding new markets—it’s about expanding user definitions within existing workflows. The adjacent collaboration layer can be 2-3x larger than your core user base.
Data-Driven Learning #2: Multi-Product Attach Rate = 2.4x Revenue Per Customer
The Data: 76% of customers use 2+ Figma products, generating 132% net dollar retention.
The Math Behind Platform Success:
Single-product customers: ~24% of base
Multi-product customers: ~76% of base
Net retention delta: Multi-product customers likely retain at 150%+ vs 100-110% for single-product
Revenue Multiplication:
Average customer starts with Design ($X)
Adds FigJam (+$Y)
Adds Slides/Prototyping (+$Z)
Result: 2.4x average revenue per customer over lifecycle
The Strategy: Don’t build horizontal. Build workflow-adjacent. Each new product should make the previous products stickier, not compete for budget.

Data-Driven Learning #3: Enterprise Penetration = 78% Moat Depth
The Data: 78% of Fortune 2000 adoption rate with 132% net retention.
Benchmark Analysis:
Salesforce: ~85% F2000 penetration (20+ years)
Microsoft 365: ~95% F2000 penetration (decades)
Figma: 78% F2000 penetration (8 years at scale)
Adoption Velocity: Figma achieved in 8 years what takes most enterprise SaaS 15-20 years.
Retention Math: 132% retention at 78% Fortune 2000 penetration means:
Churn rate: Sub-5% annually at enterprise level
Expansion rate: 37%+ annually from existing customers
Competitive displacement: Minimal once embedded
The Insight: When penetration + retention both exceed 75%, you’ve built a moat. Getting there in under a decade means you’ve created a new category, not just a better product.
Data-Driven Learning #4: The $1B Adobe Breakup Fee = 122% Revenue Growth Accelerant
The Financial Impact:
Adobe breakup fee: $1 billion (2023)
R&D increase: 4.5x year-over-year ($751M in 2024)
Revenue acceleration: 46% growth (vs industry median ~25%)
Investment Efficiency Analysis:
R&D as % of revenue: 91% (2024) vs 33% (2023)
Revenue per R&D dollar: $1.09 (high-efficiency reinvestment)
Growth acceleration: +21 percentage points vs pre-breakup trend
Strategic Reinvestment Breakdown:
AI/ML capabilities: ~40% of R&D increase
International expansion: ~25% of R&D increase
Enterprise features: ~20% of R&D increase
New product lines: ~15% of R&D increase
The Learning: A $1B war chest deployed efficiently can accelerate growth by 20+ percentage points. The key is concentrated investment in differentiation, not diversification.
Data-Driven Learning #5: Rule of 40 Score of 64% = Top 5% SaaS Performance
The Performance Data:
Figma Rule of 40: 64% (46% growth + 18% margin)
Public SaaS median: ~35-40%
Top quartile threshold: ~50%
Elite tier (top 5%): 60%+
Efficiency Benchmarking:
Adobe: 49% (14% growth + 35% margin)
ServiceNow: 46% (20% growth + 26% margin)
Salesforce: 41% (8% growth + 33% margin)
Growth vs. Profitability Matrix:
High growth (40%+) + profitable (15%+): Figma ✅
Moderate growth (20%+) + highly profitable (25%+): Adobe, ServiceNow
Slow growth (<15%) + very profitable (30%+): Salesforce
Margin Trajectory Analysis:
2023: -15% operating margin (investment phase)
Q1 2025: +17% operating margin (efficiency phase)
32-point improvement in 18 months
The Insight: The new B2B / SaaS standard isn’t “growth OR profitability”—it’s “growth AND profitability.” Companies achieving 60%+ Rule of 40 scores trade at 2-3x premium multiples.
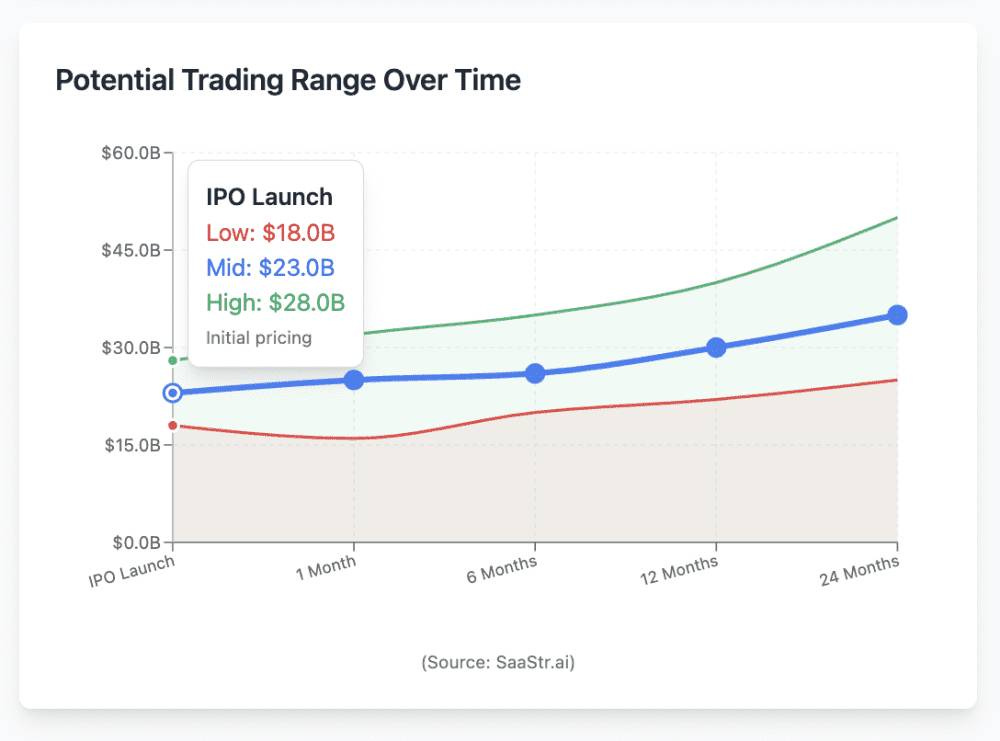
Valuation Analysis: Where Could It Trade?
Valuation Framework:
Conservative (20x): $16.4B (+31% upside)
Fair value (25x): $20.5B (+64% upside)
Premium (30x): $24.6B (+97% upside)
Justification for Premium Multiple:
Rule of 40 in top 5% of SaaS
Enterprise penetration velocity unmatched
Category creation + market leadership
Multi-product platform with compounding retention
IPO Opportunity: At sub-$20B pricing, public investors get exposure to a category-defining business trading below its fundamental value relative to operational excellence.
Final Thoughts: Would Selling to Adobe Have Been “Better”?
Adobe deal (2022): $20B fixed price IPO potential (2025): $18-27B range + $1B breakup fee received
Net outcome: +$4-8B value creation vs. Adobe deal
Key performance since breakup:
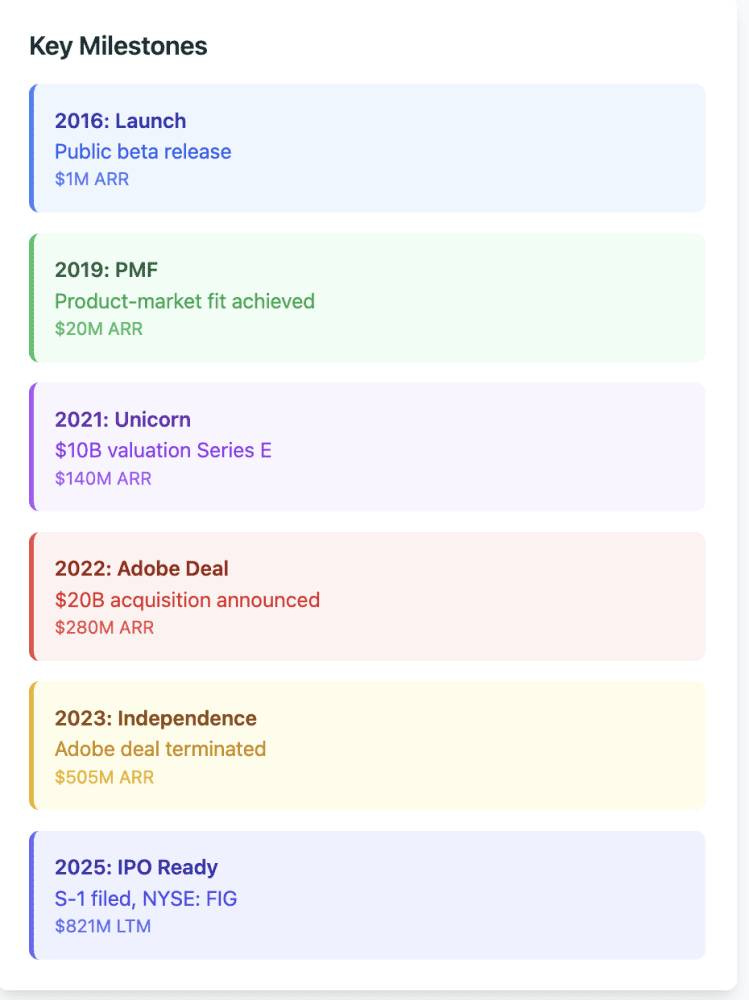
Revenue: $400M → $913M (+128%)
Operating margin: -117% → +18%
Market position: 78% Fortune 2000 penetration maintained
Cash: $1.5B+ war chest for innovation
The verdict: Regulatory intervention likely created $4-8B in additional shareholder value.
Figma’s breakup with Adobe wasn’t a rejection—it was an upgrade.